ALBA 2026 PPC Tool Development Preview
| Version 1.9 Development Preview |
|---|
| Project Lead: Jonathan Wirth, BatterieIngenieure (model parameterization and implementation) Eckhard Karden, CBI Consultant (scientific lead) |
| For the latest published version 1.0, see CBI Pulse Power Characterization Tool |
This is a CAE sizing tool for the pulse-power performance of 12V lead-acid (flooded, enhanced flooded, or AGM) batteries in auxiliary and backup applications. Outputs describe a generic battery that just matches all Pulse Power Characterization (PPC) requirements stated in clause 10.3 of IEC 60095-8 (CDV April 2025), which represent:
- minimum requirements for purpose-design auxiliary and backup batteries, but
- typical performances for legacy starter batteries (cf. Annex B.2 of IEC 60095-8).
Please notice:
- State of Charge (SOC) is established by discharging (1-SOC) times nominal capacity out of norm-full condition (not in % of actual capacity).
- The linear battery model delivers best accuracy for peak loads at cold temperature (typically, 30 to 75% of rated Icc at negative Celsius degrees), but is invalid for low loads like parking lights or holding a relay, or generally for use cases that would not drag battery voltage below 10.8 volts.
- Results are given for SOC attained by discharging, with or without subsequent rest period. Freshly charged batteries at the same temperature, SOC and load always perform better (in winter conditions, often by 1 V or more), but component sizing would usually not rely on such transient performance boost.
- Capacity sizing usually involves additional requirements and is not covered by this tool.
Background and application information about these and additional aspects is provided in the text below.
Please choose your application case (model equations are equivalent for all three versions):
- Case 1: Icc rating for a specified scenario
Given are all parameters of the relevant power application: not only operating windows for battery temperature and %SOC, but also peak current and voltage dip allowance. The tool will output the required “cold cranking current” (Icc or CCA depending on naming convention) and graphically show sensitivities against each of the input parameters. - Case 2: Current that the battery can deliver
Given is a battery type (Icc or CCA rating) and operating window (temperature and %SOC), as well as the minimum voltage that can be tolerated during discharge power peaks. The tool will output the maximum peak current that can be delivered and graphically show sensitivities against each of the input parameters. - Case 3: Voltage that the battery can sustain
Given is a battery type (Icc or CCA rating) and operating window (temperature and %SOC), as well as the peak current that needs to be delivered. The tool will output the minimum voltage during a peak and graphically show sensitivities against each of the input parameters.
Content
- Validity and basic assumptions
- Model structure and parameterization
- Application Notes
- Why is the minimum allowed voltage dip so crucial?
- SOF definition and parameterization
- SOF, battery monitoring and Functional Safety
- Why is my measured battery performance always better? Effects of recent charging
- Which SOC scale do we use?
- Which assumptions do we make for end-of-life (EOL)?
- Icing: Can my battery freeze?
- Future versions
Validity and basic assumptions
The dynamic battery model in this tool has been developed and parameterized based on extensive pulse-performance mapping data for 17 battery types (cf. IEC 60095-8, Annex B.2). Additional data points were obtained from tests with aged batteries, at extreme temperatures down to -40°C, and with more complex profiles than single-pulse discharges. Parameter ranges for model validity are suggested in the table below. Please notice that all voltages are calculated at battery terminals (not taking voltage drops along power cables into account).
Parameterization has been optimized for low temperatures and moderately high peak loads, coinciding with typical OEM design cases for 12V battery power. Moderate accuracy can be achieved for a significantly broader range of operating conditions, as classified in the following table.
| Parameter | Good accuracy (typical design case) | Moderate Accuracy |
|---|---|---|
| Battery type | Flooded, enhanced flooded (EFB), AGM in EN, JIS, BCI containers | other battery designs, e.g., motorcycle or UPS (not extensively verified) |
| Battery age | Beginning of life (after initial performance testing) | End of life (after failure in laboratory ageing tests of in vehicle) |
| Temperature | -30 °C … +4 °C | -40 °C … +40 °C |
| SOC (% of Cn) | 50% … 90% (BOL) 75% … 90% (EOL) SOC=x% is established by discharging (100-x)%Cn out of a norm-full battery. | 30% … 100% (BOL) 60% … 100% (EOL) Mapping data reveal some deviations from modeled linear SOC dependency |
| Icing | see section “Icing” below: battery operation not recommended (battery would degrade in too few winter months) but model output is still reliable | many data points for -30°C ~30% SOC, some data points for -40°C ~50% SOC |
| Peak current | (0.3 … 0.75) ⋅ Icc | (0.15 … 1) ⋅ Icc Mapping data reveal some deviations from linear current/voltage model |
| Minimum voltage during peak | 8.5 V … 10.5 V | 7.5 V … 10.8 V |
| Peak duration | 2 s … 5 s: voltage under constant load falls only very slowly (negligible versus other errors) | <2 s: discharge performance will be slightly better than modeled. 5 s … 10 s: very few data available - please reconsider t2 in your scenario (cf. section “SSOF definition” below) |
| Pre-discharge (supply loads before peak) | Not applied in parameterization tests | Model output remains valid after pre-discharge by up to 120 s duration and 3% SOC change (t1 and I1 · t1 / Cn, cf. section “SSOF definition” below) |
| Charging prior to discharge peak (normal vehicle operation) | Model describes only worst-case performance of a battery that has only been discharged into test SOC. | Not modeled: A freshly charged lead battery exhibits significantly elevated voltage in open-circuit and discharge condition as long as charge balance is >1% Cn (typically, up 0.5 ~ 1.5V at temperature <-15°C). |
| Battery size (CCA rating) | Icc = 160 A … 800 A | Icc = 100 A … 1000 A |
Model structure and parameterization
Background: Why was the PPC Test introduced 2025?
Besides its capacity rating for its energy storage function, the “cold cranking current” (CCA or Icc) characterizes the power performance of automotive batteries. This labeling system continues to be used for automotive batteries that do not start engines: so-called auxiliary or backup batteries. As a verification method, however, legacy cold-cranking tests may not be sufficient to characterize their power performance. Moreover, they may prevent certain design optimizations for dedicated auxiliary or backup battery types. Typical non-starter peak loads will draw fractions of rated cold-cranking current only but require battery voltages well above 7.2 or 6 volts for a few seconds or fractions of a second, usually at partial state of charge (see “chassis loads” in table). Consequently, clause 9.4 of IEC 60095-8 – the first industry norm for automotive batteries that are not starting an engine – introduces a new method for pulse-power characterization (PPC).
.CnYktCwQ_ZT72CL.webp)
PPC “requirements”: Mandatory for new auxiliary & backup battery types - only typical performance for legacy (general-use) battery types
IEC 60095-8 requirements for PPC apply only to dedicated auxiliary or backup batteries, i.e., battery designs that have been optimized for auxiliary or backup applications and are not intended for engine-starting. By contrast, IEC 60095-8 defines general-use automotive batteries, which underwent full cold-cranking performance verification (legacy cold-cranking test) but may be used in auxiliary or backup applications as well.
- For general-use automotive batteries, IEC 60095-8 does not define PPC requirements, but full legacy CCA testing is sufficient. Applying the PPC test in addition is only recommended.
- For dedicated auxiliary or backup batteries, the cold-cranking test methods and requirements have been cut to the first 10 seconds discharge only, but performing the PPC test in addition and meeting PPC requirements are mandatory.
IEC PPC requirements were determined from PPC mapping data with up to 17 state-of-the-art automotive battery types, only one of which was a dedicated auxiliary/backup battery design. These batteries included 4 flooded and enhanced-flooded types in JIS B19 to D23 sizes, 3 flooded types in EN LN1 to LN3 containers, 3 EFB types in EN LN2 to LN3 containers, 4 prismatic AGM types in EN LN0 to LN4 containers, 2 spiral-wound AGM in BCI Group 34 containers, and one auxiliary AGM type (18 Ah). PPC requirements were set close to the median of the legacy battery types evaluated. This means that
- they represent typical performance of general-use automotive batteries (individual “starter” battery types may perform significantly weaker or stronger as illustrated in the diagrams below), but
- they are minimum performances to be verified for each dedicated auxiliary or backup battery type!
Such stringent requirement-setting has been applied to avoid inflation of CCA ratings on legacy or stripped-down automotive designs, following the deletion of U30s and t6V requirements for CCA(AUX) testing. This should also prevent customers from employing underpowered, but geometrically compatible dedicated auxiliary or backup batteries in traditional starter battery applications, despite not being advised to do so.
.C1rt1HHG_Z1B5NCK.webp)
What does this PPC-based battery sizing tool output?
This tool predicts battery performance for pulse discharge loads. All physical quantities are given at the battery, which includes electrolyte (not ambient) temperature as well as battery-terminal voltage (not system voltage at any other distribution point).
The generic battery model inside this tool has been parameterized for a hypothetic battery design that precisely matches (i.e., borderline passes) IEC requirements. These requirements are only defined for three operating points in temperature and SOC: (25°C, 100%), (-18°C, 80%), (-18°C, 50%).
For other temperatures and SOC levels, our battery model has been fitted to PPC performance mapping data obtained during PPC test validation and requirements setting (see previous paragraph, and more detail in Annex B of IEC 60095-8). The following 3D diagram shows an example for the temperature and SOC dependency of peak current (at 9.2 volts) for a 35 Ah 380A AGM battery: load currents in the test were cut off at 300A - other than this apparent saturation, lead battery power performance varies very smoothly and almost linearly with temperatures down to -30°C and SOC down to 30%.
.j2MOqt9e_Z1Ipemp.webp)
Consequently, outputs of this CAE tool represent
- typical performance of general-use or legacy starter batteries, which have been subjected to full legacy cold-cranking testing (30-seconds voltage or t6V proven): individual battery types may under- or overperform
- minimum (guaranteed) performance of dedicated auxiliary or backup battery types, which have been subjected to the 10-seconds CCA(AUX) test only.
For a future version of this CAE tool, we plan to allow uploading your own parameter sets that would more precisely characterize individual battery designs and types.
This model is not suitable for prediction of low-load battery performance as would be required for hazard warning or position lights, holding a brake if not mechanically locked, etc.). Such requirements typically affect capacity sizing of the battery rather than Icc sizing.
Model equations & parameters
The model equations behind the calculation sheets are as follows:
I_cc(T, SoC, U_min, I_max) = I_max / G_dc(T, SoC) / (U_0,eff(T, SoC) - U_min)
I_max(T, SoC, U_min, I_cc) = (U_0,eff(T, SoC) - U_min) ⋅ G_dc(T, SoC) ⋅ I_cc
U_min(T, SoC, I_max, I_cc) = U_0,eff(T, SoC) - I_max / (G_dc(T, SoC) ⋅ I_cc)

with

U_0,eff(T, SoC) = K0 + A0 ⋅ e^-(k0_T / R / T) + f0_SoC ⋅ SoC
G_dc(T, SoC) = K1 + A1 ⋅ e^-(k1_T / R / T) + f1_SoC ⋅ SoC

// Input parameters
T      // Temperature in K
SoC    // State of Charge in C_n (0 … 1)
U_min  // Minimum voltage in V
I_max  // Maximum current in A
I_cc   // I_cc in A

// Begin-of-Life parameters
K0 = 9.8926
A0 = 15.376
k0_T = 5261.2
f0_SoC = 0.44345
K1 = -736.11
A1 = 737.17
k1_T = 2.7001
f1_SoC = 0.13572

// End-of-Life parameters
K0 = 9.7368
A0 = 15.376
k0_T = 5261.2
f0_SoC = 0.59926
K1 = -566.27
A1 = 567.05
k1_T = 2.7001
f1_SoC = 0.14108

// Constants
e = 2.7183
R = 8.3145
Application Notes
Why is the minimum allowed voltage dip so crucial?
The allowed peak-discharge voltage in a vehicle application has a major impact on battery sizing, as illustrated in the figure below this paragraph for a typical AGM battery: At temperature of -18 °C or below, and SOC under 75%, the same battery delivers 2.5 to 3 times higher current I1 at 9.2 V than I2 at 10.5V.
.DFoK7gD0_1SdeNK.webp)
Many system designs for electrified chassis systems and other peak-power loads would initially assume 10.5 volts as a minimum battery voltage, or even worse, as a minimum input voltage at the load (with typically 0.5 V drop along connections from the battery terminals). As will be evident from sensitivity plots provided by this tool, such high peak-voltage requirements would lead to very inefficient power-supply system solutions: either a drastically oversized battery or an additional combined energy-storage and power-conversion system just to supply peak power at such high voltages. System design optimization should instead aim at robust function delivery of the peak-load system: A reasonably (down-) sized lead battery can certainly deliver the peak power needed but much more efficiently at 9.5, 9.0 or even around 8.5 volts.
SOF definition and parameterization
This tool predicts U2 (or I2) for a generic load scenario as shown in the diagram below, which utilizes the concept of State of Function (SOF) introduced by Meissner and Richter 2003 (Journal of Power Sources 116, 79-98). For a given application-specific load profile I(t) as exemplified in the insert (left), you may obtain the generic parameters as follows:
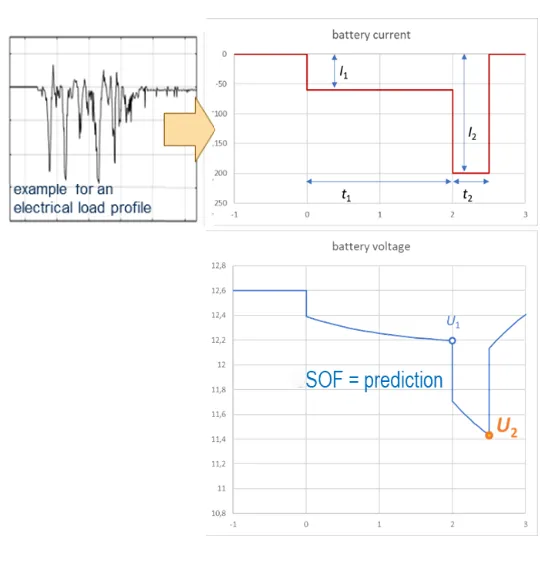
- I2 is the maximum current that occurs during the application-specific load profile. If the load scenario is defined in terms of electrical power, divide the maximum peak-power requirement by the minimum peak-voltage allowance. For example, a double lane change maneuver requires four power peaks (and other chassis loads may add more peak requirements). For the construction and parameterization of the generic SOF profile, all four (or more) pulses are lumped at the end of the scenario, as if all steering maneuvers occurred at once at the end of the base-load supply time. This is a worst-case assumption.
- t2 is the lumped duration of all power peaks. It is suggested to approximate it as the sum of all peak durations while battery discharge current exceeds 0.5 · I2. It is not the time span during which pulses may occur, see t1 + t2 below. Typically, t2 varies between fractions of a second (for a single steering or braking maneuver) and 5 seconds (for complex multi-pulse sequences).
Extensive testing has shown that lead batteries (unless recently charged, see next section) have a very stable discharge voltage for a duration of 2…5 seconds. For shorter peak durations, the model output will be overly conservative, and you may wish to determine your application-specific downsizing factor by systematic experimentation. - t1 + t2 is the overall duration of the application-specific load profile. Typically, the battery has to power base loads before and between the peak-power pulses.
- I1 is chosen such that the discharge current integral of the entire SOF profile equals that of the application-specific load profile. It represents the average base load demand before and between the peak-power pulses.
This sizing tool contains a linearized model for the relationship between I2 and U2 for typical durations t2. For an extended range of lumped peak duration, the same outputs are displayed, indicating reduced accuracy (systematic underestimation of dc resistance for t2< 2 s, systematic overestimation of dc resistance for t2> 5 s). This tool, however, does not require input of the parameters I1, t1. Rationale: The pre-discharge (I1, t1) has barely any effect on U2, as evidenced by multiple back-to-back tests, of which one example diagram is shown below, where charge balance (not time) is the abscissa: Two profiles of identical ampere-seconds integral (0.56% Cn) were compared on an LN2 AGM battery, Cn=60Ah, Icc=600A, beginning of life (BOL), at 50% SOC and -18°C, repeatedly during partial cycling between 50% and 60% or 50% and 80% SOC:
- 8 seconds peak-discharge at 150 A = 0.25·Icc (single step as modeled in this tool)
- 30 seconds base-load 30A = 0.5C rate, followed by 2seconds peak-discharge at 150 A = 0.25·Icc (2 steps as required for the SSOF profile)
.CYAISDGF_ZYyllX.webp)
SOF, battery monitoring and Functional Safety
The state-of-function (SOF) concept can be very powerful for battery monitoring, too. Where the vehicle relies on power performance of the battery, the signal definition of the intelligent battery sensor (IBS) or other battery monitoring system (BMS) should be defined as SOF, too. This will enable systematic verification and allow appropriate algorithm solutions for instantaneous prediction (e.g., short-term observers) that may be insensitive against inaccuracies of state of charge (SOC), remaining capacity, etc. As will be shown in the following section, SOF of a freshly charged battery is only loosely correlated with its absolute SOC, for example. Unlike this sizing tool, an online in-vehicle SOF prediction would have to factor in this transient boost of pulse-discharge performance in order to maximize availability of vehicle functions.
Many vehicle functions that demand 12V peak power are relevant for Functional Safety of the vehicle (ISO 26262). A 12 V battery is often used as one of the redundant power sources for such loads. The battery (cell stack) itself is not an electric or electronic component. An ASIL rating will have to be cascaded to the battery monitoring system. Using state-of-function interfaces enables efficient solutions for short-term prediction and its verification, too. It has been suggested to label ASIL-relevant SOF signals as SSOF, safety state of function. For such applications, I1 is the average base load current to be supplied by the battery under question between fault occurrence (e.g., shutdown of the dc/dc converter) and the last power pulse required for the back-to-safe scenario.
Why is my measured battery performance always better? Effects of recent charging
If you compare vehicle test data with our sizing model output, you will most likely find that every real battery performs significantly better than predicted. This is not a failure of our model but intended.
- Our model predicts performance of a generic battery that has been only discharged (at nominal conditions) into the target state-of-charge and then chilled to the test temperature. This is the worst-case condition. Most OEMs will use this condition for battery sizing. Our tool is meant to support battery sizing and selection.
- In your test vehicle (or breadboard power-supply test setup), the battery has most likely been charged prior to the SSOF discharge test, by normal operation of the dc/dc converter, alternator or other primary 12V energy source. Recent charging, even by only small change in state-of-charge (SOC), always leads to significantly elevated battery voltages - not only at rest (open-circuit condition) but also under subsequent discharge (state of function, SOF) as long as the charge balance remains significantly positive. The higher battery voltage is caused by pseudocapacitive and thermodynamic (potential plateau) effects of the positive active material, as well as acid concentration gradients. None of these effects is modeled in this tool, and most OEMs would rarely size batteries such that their performance would meet demand only after some minutes of charging. For illustration, the diagram below shows comparative voltage traces out of charging from the same test series as shown in the previous section: By charging only 3% SOC, the SOF for the given load profile improved by approximately 0.6 V. For a shorter SOF scenario (up to 300 As discharge in this example), pseudocapacitive effects may have caused significantly larger voltage elevations even.
.Cf9fZvEd_ZscgIG.webp)
Recommendation: If you size your battery for discharge performance out of equilibrium or discharge, test them in this condition, too. Freshly charged batteries will always overperform significantly. Whether you may utilize this overperformance to improve feature availability during charge recovery after almost-abusive or unintended battery discharge, or even for near-end-of-life batteries, is a question to your battery state detection reliability, not primarily to battery sizing.
Note: The charge recovery test procedure in IEC 60095-8, for the first time in automotive battery standardization, establishes a test methodology and minimum requirements for the transient SOF boost during and out of charge recovery. OEMs may specify the same test procedure and set requirements to their application needs and proven best-in-class battery performances. See Annex C of IEC 60095-8 for more detail.
Which SOC scale do we use?
In analogy to PPC test definition in IEC 60095-8, we use the following SOC scale. If your battery monitoring system works to a different SOC specification, you should convert SOC.
- SOC = 100% is achieved by a norm charge for begin-of-life batteries. For end-of-life batteries, sulfation may prevent this condition to be achievable: If sulfation blocks the upper 10% Cn from being recharged, we would call the fully-charged condition 90% SOC. Capacity losses by sulfation are deduced from the maximum attainable SOC, not from the remaining capacity Ce. Rationale: Sulfation is just the accumulation of discharged active material in structures that resist recharge under normal operation. If conditions (temperature, charging time, etc.) change, sulfated material may be restored. Moreover, most battery monitoring systems use voltage at an essential point to determine SOC. They can’t distinguish then how much of the gap between current SOC and 100% is practically rechargeable.
- SOC = x% (x < 100) is attained by removing x% of Cn from the (hypothetically) fully charged battery, irrespective of battery age.
For an end-of-life battery, assume the following scenario: upper 10% may be unattainable due to sulfation, lower 30% of Cn (plus any excess capacity by which Ce exceeded Cn at BOL) may be unattainable due to positive active material (PAM) wear. The measured Ce in a capacity test would be 60% of Cn. Various OEMs may define the remaining capacity as 60% or 70% of Cn depending on how they treat sulfation. Our sizing tool (like IEC PPC requirements) would define SOC=80% as 20% of Cn under the hypothetic fully charged condition. Practically, after a laboratory charge, its SOC would be only 90% in our scale, so we would only discharge it by 10% of Cn, which is 16.7% or 14.3% of Ce in either of the above OEM definitions.
Which assumptions do we make for end-of-life (EOL)?
Various ageing processes govern degradation capacity and power of lead batteries over service life. Which one is dominant for a given battery depends on climatic and vehicle-usage conditions, as well as on charging and operating strategy chosen by the OEM. For our end-of-life option, it is (fortunately) not necessary to predict when and how the battery will reach this condition. We only have to reduce capacity and power parameters by a proportion at which regular starter batteries would usually be replaced or the vehicle may demand / recommend preventive battery replacement. Experience with EN L-sized batteries (in many decades of starter battery use) tells that this end-of-life condition is reasonably well approximated by a new (BOL) battery of similar design but 2 EN stages smaller, for example, performance of an EOL LN3 battery is approximately equivalent with that of a BOL LN1 battery of the same product range.
The EOL battery in our model is characterized by
- bottom-end (PAM wear) capacity loss of 26% Cn
- effective dc resistance increase of 30% over BOL, or in other words CCA(AUX) and PPC performance reduction by 1-(1/130%) = 23%.
Carrying over EOL:BOL proportions for auxiliary batteries from field experience with starter batteries in legacy automotive applications is considered appropriate because (a) many auxiliary battery applications utilize legacy “starter” battery designs, and (b) dedicated auxiliary battery designs will still fail due to the same mechanisms, and should match the same EOL performance requirements in relation to their BOL performance.
Icing: Can my battery freeze?
Lead batteries use sulfuric acid, an aqueous solution, as electrolyte. The phase diagram shows a concentration-dependent freezing point (for example, -40°C at about 1.23 g/cm³ and -20°C at about 1.16 g/cm³). Such low concentrations are reached at low state of charge - first locally inside the pores of the positive electrode, thanks to acid consumption during the discharge reaction and asymmetric ion mobility.
- It is not recommended to size a lead battery for regular operation below the icing curve because ice crystals might gradually cause damage (premature ageing) to the positive active material, or in extreme cases damage container and lid. Therefore, model outputs are shown as invalid for such conditions, and a warning will be displayed in the results box.
- Nevertheless, extensive SOF mapping data from PPC test validation for from IEC 60095-8 provide empirical evidence that model outputs remain valid far below the icing curve! Within a broad range of (temperature, SOC) conditions above and below the icing curve, lead batteries will reliably deliver instantaneous power, and observer-based battery monitoring algorithms will reliably predict their performance. Even below the icing curve, discharge power performance continues to degrade with lowering SOC and/or temperature smoothly and continuously along the same trend lines established above. There is no phase-change transition in discharge performance observed!
The apparent discrepancy between both statements can be resolved by understanding the physical mechanism of “icing” in aqueous solutions of sulfuric acid. The process is not bulk freezing like it destroys a bottle of water in the freezer. Instead, within the pores of lowest local electrolyte concentration and temperature, ice crystals are formed that consist of water H2O only. They swim in the remaining liquid acid that consequently rises in concentration until exceeding the level of the icing curve for the given temperature. If discharge continues, water-ice crystals will form in other pores, just as their concentration falls below the icing curve. The discharge current distribution will most likely evade regions with high ice-crystal concentration because they narrow effective pore diameters and hence, gross (macrohomogeneous) electrolyte conductivity locally. The extension of current paths through lead grids, though, will only marginally increase overall battery resistance (as evidenced by our mapping results) - considering low overall acid concentration and the opposite temperature coefficients for conductance of lead versus electrolyte. The described process of local icing sets in at state-of-charge levels with an average acid concentration well above the icing curve, locally in uppermost positive electrode pores of end cells exposed to cold ambient. During continued discharge or cooling, it will then spread very gradually, and never rapidly down to very low average acid concentrations.
| Data point | Temp / °C | SOC / %Cn | Average acid g/cm³ | Observation |
|---|---|---|---|---|
| Electrical test (violet curve end) | -30 °C | 27% | 1.14 | no bulk freezing |
| Icing curve | -15 °C | 27% | 1.14 | no sudden performance drop at (-15°C, 27% SOC) |
| Icing curve | -30 °C | 56% | 1.21 | no sudden performance drop at (-30°C, 56% SOC) |
.CJfmNRfy_Z7qN9e.webp)
The diagram above shows continuous, almost linear battery performance degradation to SOC<30% at -30°C for a typical automotive battery (LN0 35Ah 380A). In this series of experiments, SOC was (largely) established at nominal conditions, battery then chilled to test temperature, and test pulses were applied with constant voltage of 9.2V and a current limitation of 300A (but no constant current pulse below 300A), such that the current “capability” of the battery was directly measured. No phase-change like degradation can be observed anywhere in the low-SOC performance at -30 nor -18 °C.
In summary, your battery, or its electrolyte, will not freeze as a bulk, but small ice crystals will form within (and between) the porous plates. This will occur gradually while SOC or temperature are falling, and gradually reduce the battery’s power performance. As our model parameterization measurements covered operating points well below the icing curve, the instantaneous voltage can be predicted reliably, and no sudden loss of function or performance is to be expected. Nevertheless, battery operation below the icing curve should be avoided to prevent premature ageing. Consequently, the results box will declare results invalid in this case and output a dedicated warning mentioning “icing”.
Future versions
Please let us know your experience, questions, and suggestions for additional functionality. CBI plans to expand this model in the near future. Tentatively, the following extensions are under consideration:
- allow input of 12V electrical power requirement rather than only current
- allow input of 2-step profiles with pre-discharge
- large-pulse extension of validity range U2 < 8V, I2 > 0.75 Icc, and/or t2 > 5s (requires additional verification testing but probably no major model upgrade)
- integrate capacity sizing tool - probably based on user input of a ratio Icc: Cn
- allow selection of real battery types rather than generic just-IEC only: either as drop-down list of pre-parameterized types or by adjusting generic parameters using additional inputs like weight and 1 kHz resistance?
- offer instructions and interface for mapping your own battery type and creating a type-specific parameter set